My Business
The numbers your product is already sitting on.
Whatever you built here has been recording orders, customers and bookings all along. My Business reads that and tells you where the month actually stands — in a paragraph, not a wall of charts.
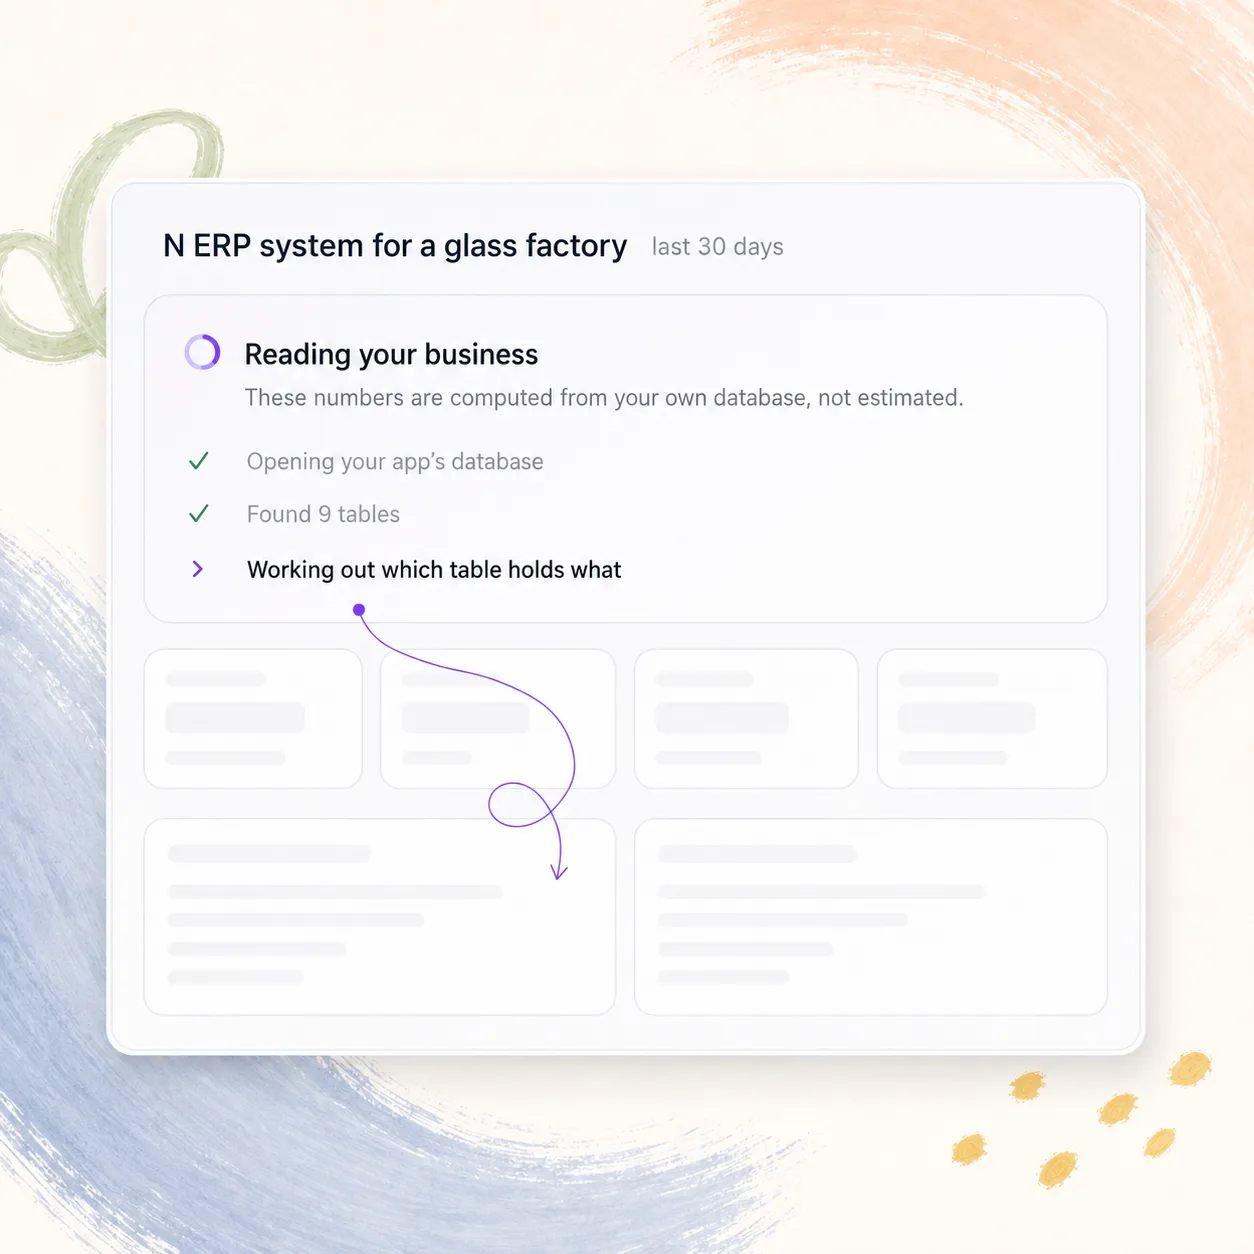
It builds dashboards from your own data
Stunning reads the business data behind your app — the orders, the customers, the items — and turns it into dashboards. Data still sitting in another system comes in as an Excel or CSV file and becomes dashboards the same way.
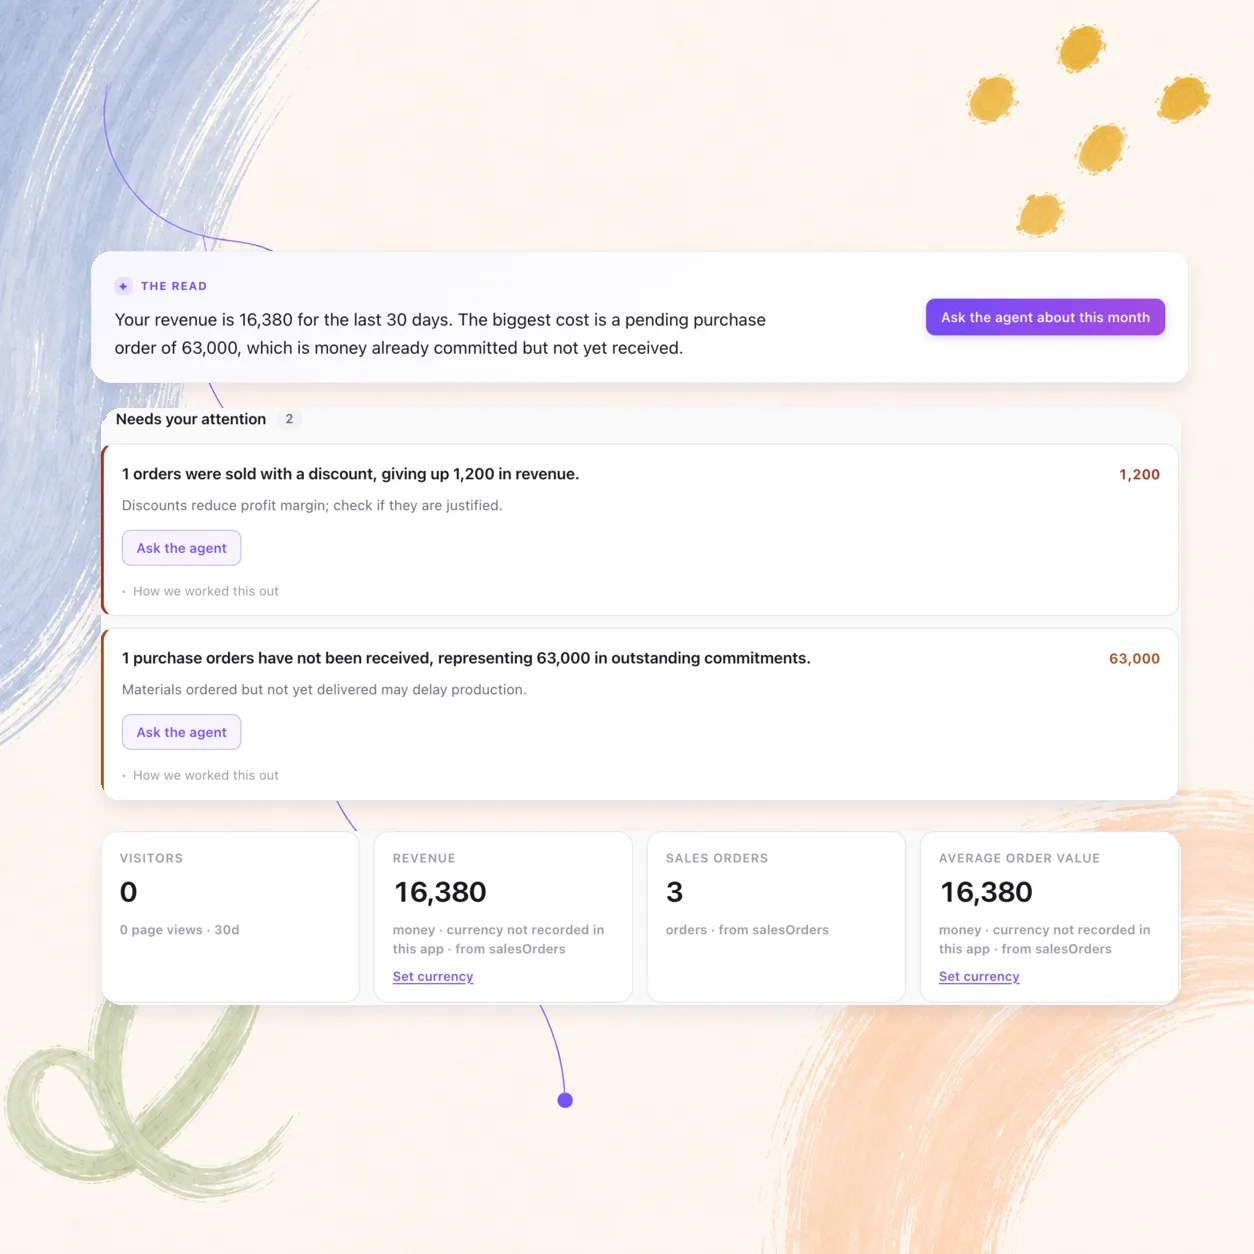
Three sentences, before any chart
Where the headline figure landed and which way it moved, the thing costing you the most right now, and one thing that is going well. Read it in ten seconds, then dig if you want to.
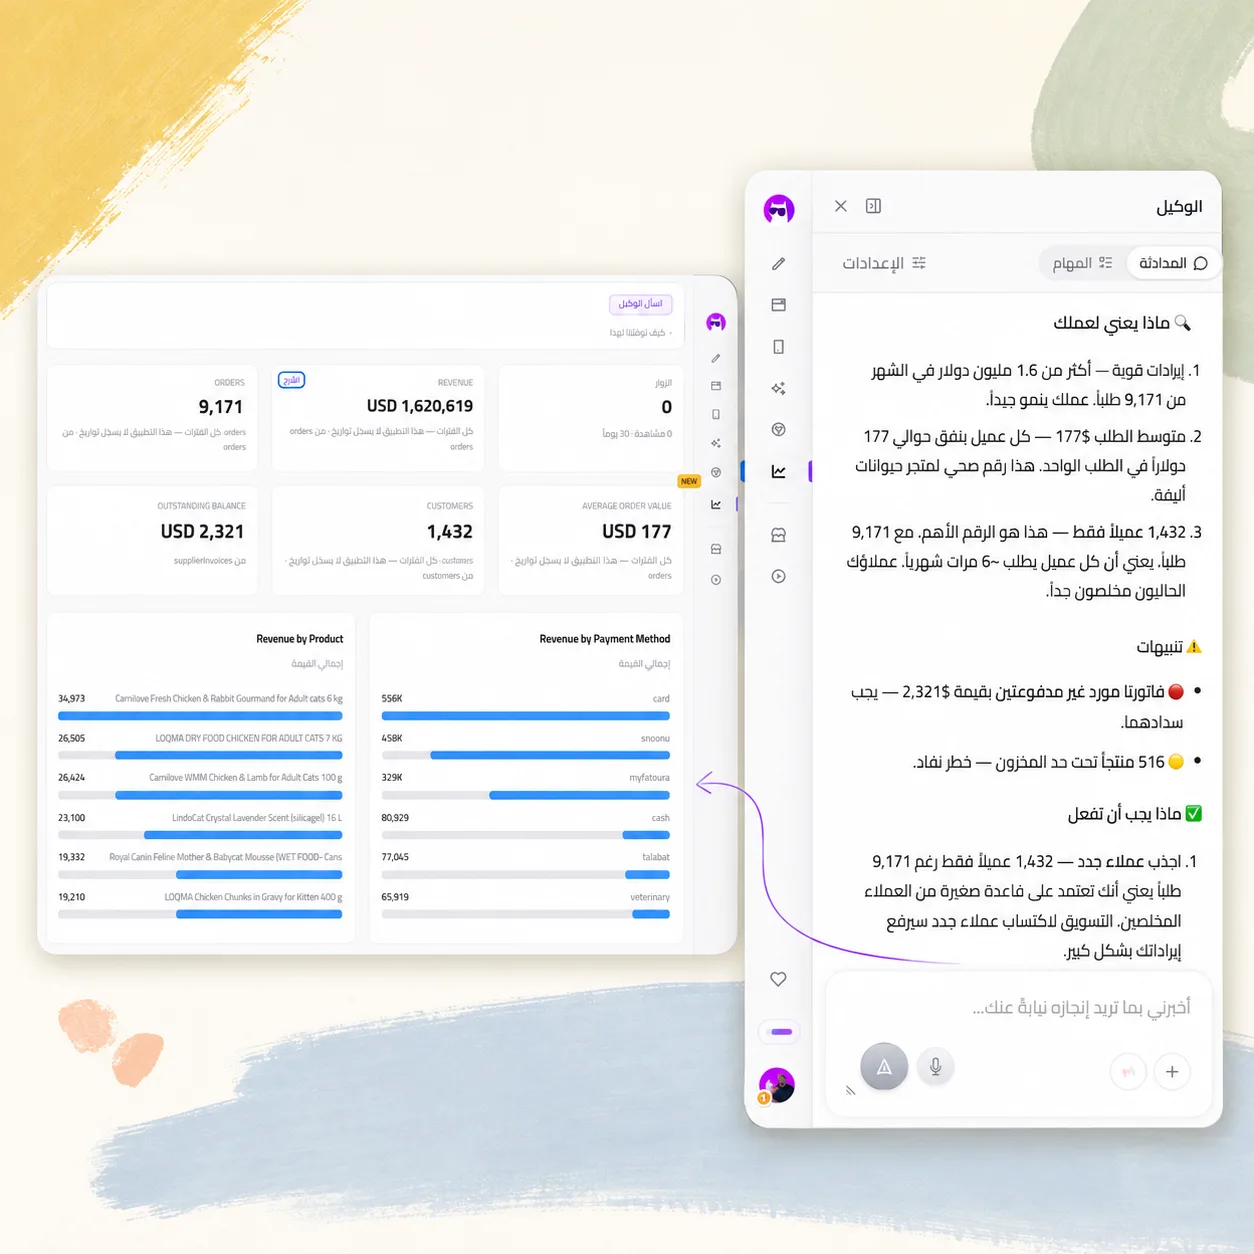
Every finding shows its working
Not just "you have unpaid invoices" — the amount at stake, why it matters, and the exact test behind it, down to the column and the window. Every figure is computed from your rows in code, never written by the model, so you can check the claim yourself.
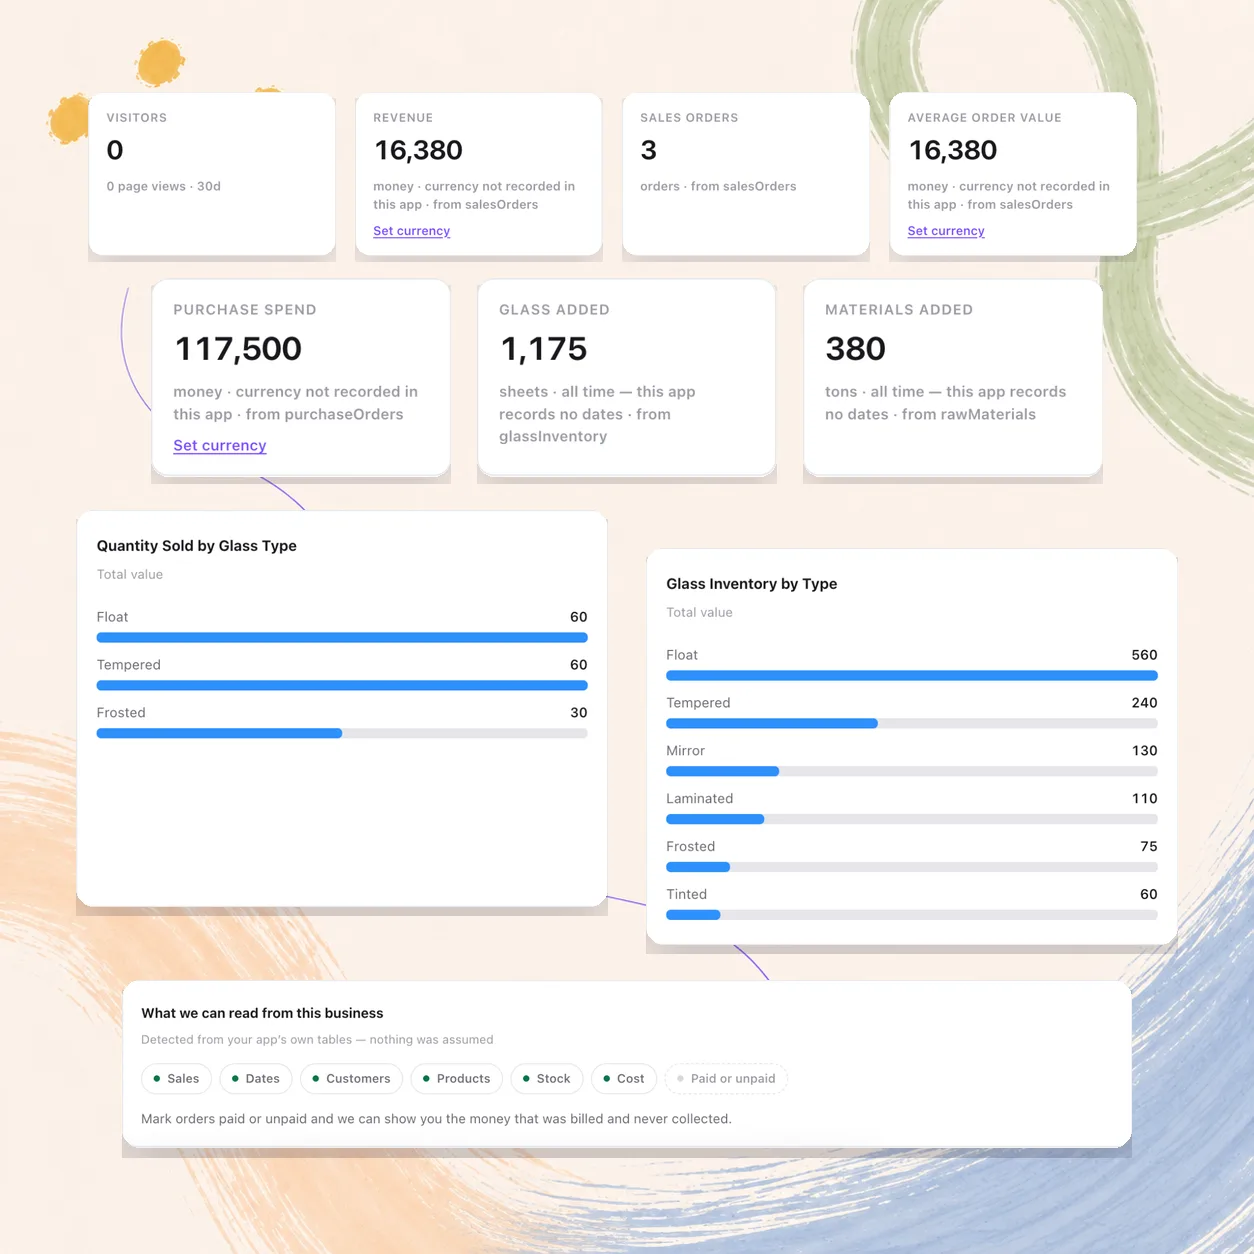
A dashboard shaped by your data
The tiles and charts come from what your business actually records, not a fixed template. Drag them around, resize them, hide what you do not care about — or ask the agent for a metric and it adds one.
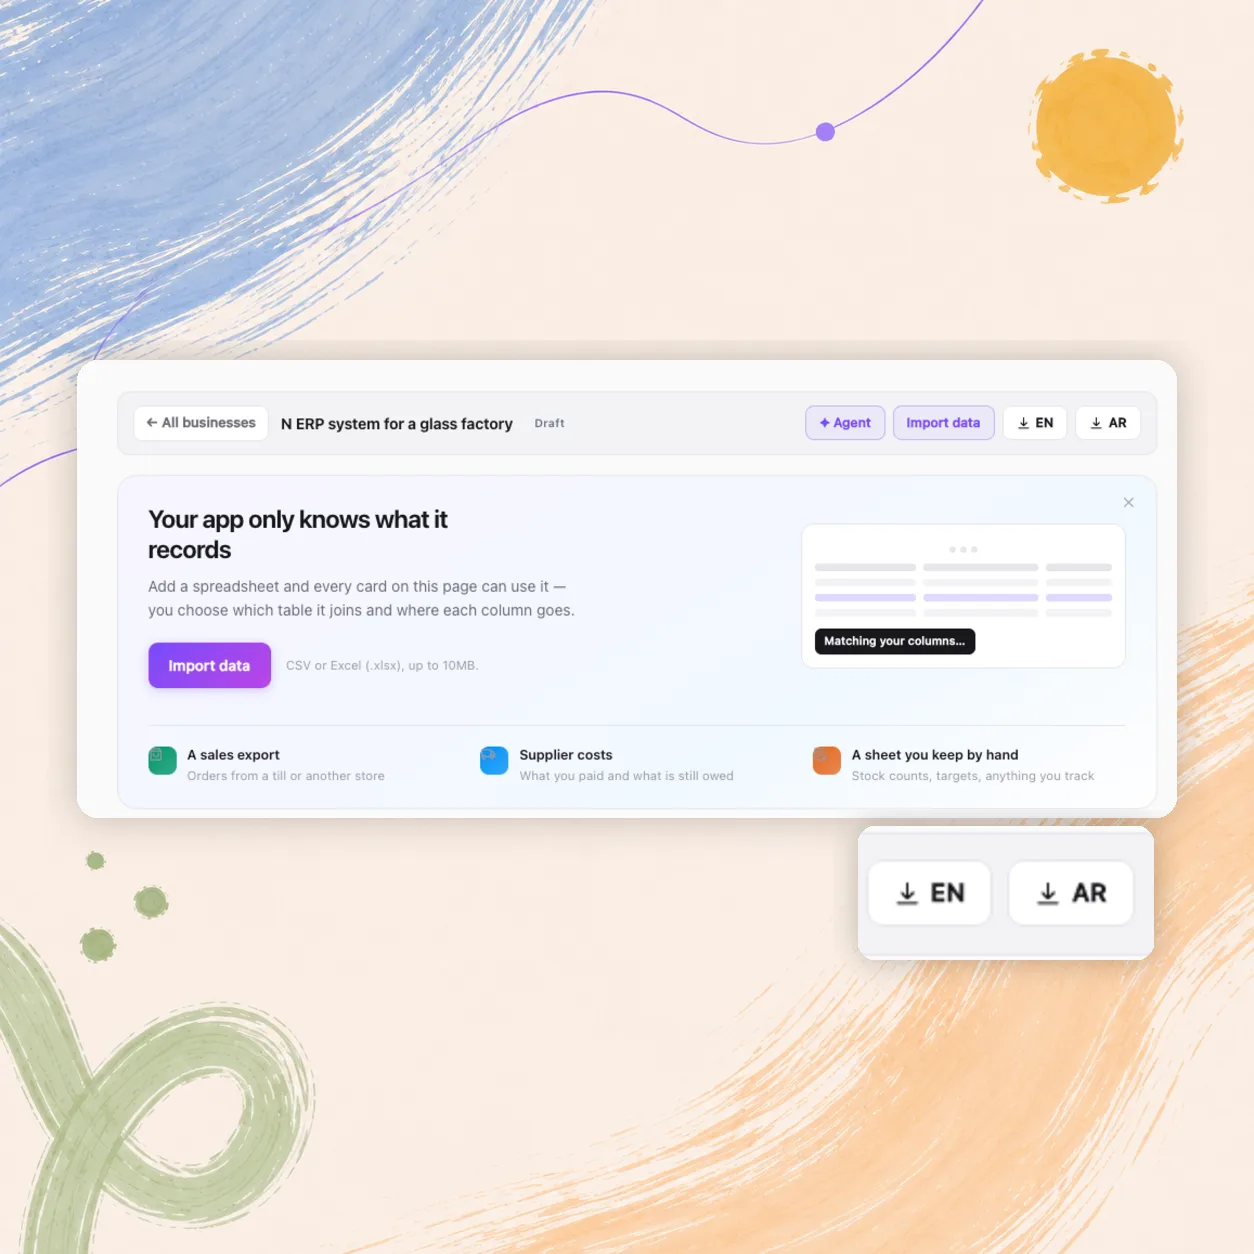
Something to take into the meeting
One page as a PDF, in English or Arabic, with the summary, the numbers, what needs attention and the reasoning behind each one. Properly typeset in Arabic, not a translated afterthought.
Questions
No. It reads the database of the app you built here, and visitor numbers come from Stunning itself. There is nothing to add to your site.
Running an analysis costs a few credits and only happens when you press the button — opening the page never charges you. Coming back to an analysis you already ran is free.
They are from the last time you ran the analysis, and the page tells you when that was. Re-run it whenever you want a fresher picture.
A database with something in it. If the app was built here and stores orders, bookings or customers, there is something to read; a brochure site with no data has nothing to report.
Whatever your data supports. A shop that records cost prices gets findings about margin; one that tracks payment status gets findings about money billed and never collected. It is built around your schema rather than a fixed checklist.
The summary, the findings and the PDF report come in Arabic or English. Some chart titles are still English while that work finishes.
Yes — reorder, resize and hide cards yourself, or ask the agent to add a metric, a breakdown or an alert. Rearranging is free and instant.
Open the working behind it. Every finding names the column and the test it used, so you can check it against your own records — and you should, before acting on it.